Health, version and alerts
This page is for whoever runs the server. It covers what Chiban reports about itself, what raises an alert, and where the alert goes.
The three endpoints
None of them needs a sign-in, and Caddy sends them to the application like any other path. They return no town data. Examples are from the demo.
| Address | Answers |
|---|---|
/api/health | {"status":"ok"} with status 200 when the application can run a query on the database. {"status":"unavailable"} with status 503 when it cannot. |
/api/health/jobs | {"status":"ok"} with status 200 when no alert is firing. {"status":"alerting","alerts":[{"key":"disk:/","kind":"disk_warning"}]} with status 503 when one or more are. {"status":"unavailable"} with status 503 when the database cannot be read. |
/api/version | appVersion, imageRef, pack and migrationHead, with status 200. {"error":"unavailable"} with status 503 when the database cannot be read. |
/api/health says whether the web application is up. The Compose healthcheck of the app service calls it every 10 seconds, allows 6 failures and waits 20 seconds after start, and the deploy script calls it while it waits for a new image to come up.
/api/health/jobs does not check anything itself. It lists the alerts that the worker's health check last recorded as firing. If the worker is stopped, nothing updates that list, and the endpoint keeps saying what it said last. To catch a dead worker, use the heartbeat below.
In /api/version, imageRef is CHIBAN_IMAGE_REF, which the bundled Compose file sets from CHIBAN_IMAGE. appVersion is the version from package.json, which is 0.0.0. pack holds the state pack's id, its version, and a hash, a SHA-256 of the pack's whole manifest, which holds its rules, classifications, record series and the rest, so two installs with the same hash carry the same pack. migrationHead is the name of the newest migration the database has applied.
What raises an alert
The worker runs a health check every 5 minutes. It looks at disk space and at the background jobs, and records an alert while a problem lasts.
| Alert | Severity | Raised when |
|---|---|---|
disk_warning, key disk:<path> | warning | A watched disk is more than 80 percent full. |
disk_critical, key disk:<path> | critical | A watched disk is more than 90 percent full. |
job_stale, key job_stale:<job name> | critical | A scheduled job has not succeeded in more than twice its interval. If it has never succeeded, the time since the worker started is used. |
schedule_missing, key schedule_missing:<job name> | critical | A job that should run on a schedule has no schedule in the job queue. |
The disks come from HEALTH_DISK_PATHS, a comma-separated list that defaults to /. The bundled Compose file sets it for the worker to /monitor/pg,/monitor/garage, two read-only mounts of the database and object store volumes. A path that cannot be read is skipped without an alert, so a typo in the list watches nothing.
An alert clears the next time the check no longer finds the problem. The background jobs page lists the jobs and their intervals.
Where alerts go
Two channels exist, and an alert goes to every one that is configured.
| Channel | Turned on by | What it sends |
|---|---|---|
ALERT_EMAIL_TO, a comma-separated list of addresses | One message per address through the same SMTP account as the rest of the mail, with the subject [critical] Town name: Disk / is 91% full. | |
| Pager | PAGER_ROUTING_KEY, with PAGER_EVENTS_URL optional | A trigger event when the alert fires and a resolve event when it clears, using the alert's key as the deduplication key. The default address is the PagerDuty Events v2 address. Any other service that accepts that format and answers 202 will do. |
PAGER_EVENTS_URL requires PAGER_ROUTING_KEY. The Health page marks the pager channel as a practice connection: "Pager alerts are not connected to a live service. They are sent to the address you configured and have only been tested against a local stand-in."
A firing alert is sent when it first appears. If at least one channel accepted it, it is sent again every 24 hours for as long as it keeps firing. If no channel accepted it, the next 5-minute check tries again. When it clears, one message with the prefix Resolved: is sent, and it is not retried.
The heartbeat
HEALTH_HEARTBEAT_URL is a web address that the health check requests with GET after every run, which is every 5 minutes. Give it to an outside monitor that alerts when the requests stop. It catches what Chiban cannot report about itself: a stopped worker, a stopped host, a lost network. A failed request is logged as [health] heartbeat ping failed.
Settings the bundled Compose file does not pass
deploy/docker-compose.yml passes only HEALTH_DISK_PATHS, and only to the worker. ALERT_EMAIL_TO, PAGER_ROUTING_KEY, PAGER_EVENTS_URL and HEALTH_HEARTBEAT_URL are validated by the application and used by the code, but nothing in the Compose file carries them from .env into a container. As shipped, no alert is delivered anywhere and the heartbeat is never sent.
To turn them on, add the ones you use to the shared x-app-environment block at the top of the Compose file, so the worker gets them, and the application too, which uses them for the Health page and the test command below. For example:
  ALERT_EMAIL_TO: ${ALERT_EMAIL_TO}
  HEALTH_HEARTBEAT_URL: ${HEALTH_HEARTBEAT_URL}
and add the matching lines to .env. Add only the settings you set. An empty HEALTH_HEARTBEAT_URL, PAGER_ROUTING_KEY or PAGER_EVENTS_URL fails validation, and the container exits at start with a line naming the setting. An empty ALERT_EMAIL_TO is accepted.
Testing the path
A channel works only once a person has received something through it. Send a test:
docker compose run --rm --no-deps app node dist/health-test-alert.mjs
In a development checkout the command is pnpm health:test-alert. It sends one message through each configured channel, prints <channel>: sent, open the link to confirm or <channel>: failed, and exits 0 only if every channel sent. With no channel configured it exits 2 and says to set ALERT_EMAIL_TO or PAGER_ROUTING_KEY.
The message carries a link to the public page /alerts/ack/<token> on the town's address. Whoever receives it opens the link and presses Confirm I received this alert. Test alerts do not appear under firing alerts.
The Health page
An administrator opens Settings, Administration, Health. It needs the permission to edit configuration.
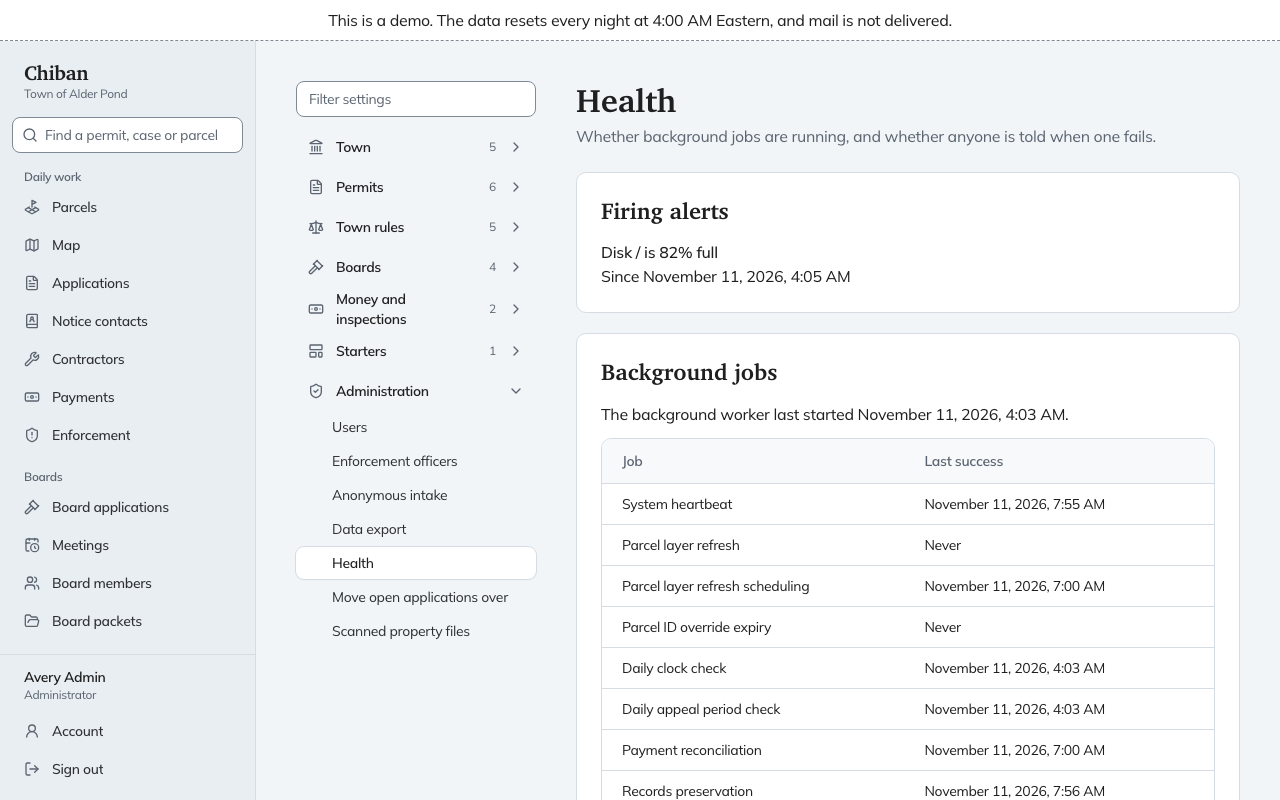
- Firing alerts lists each firing alert with the time it began, or says no alerts are firing.
- Background jobs says when the worker last started, then lists the jobs. A job that is overdue or whose last run failed is pulled up under Needs attention with its last success and last failure. If no worker has ever started, the page says so and that no job will run.
- Alert channels shows each configured channel and its test state: Never tested, Test sent, not acknowledged, or Acknowledged within the last 30 days. With none configured it says nobody is told when a job fails, and names
ALERT_EMAIL_TOandPAGER_ROUTING_KEY.