Permit volume, processing time and revenue reports
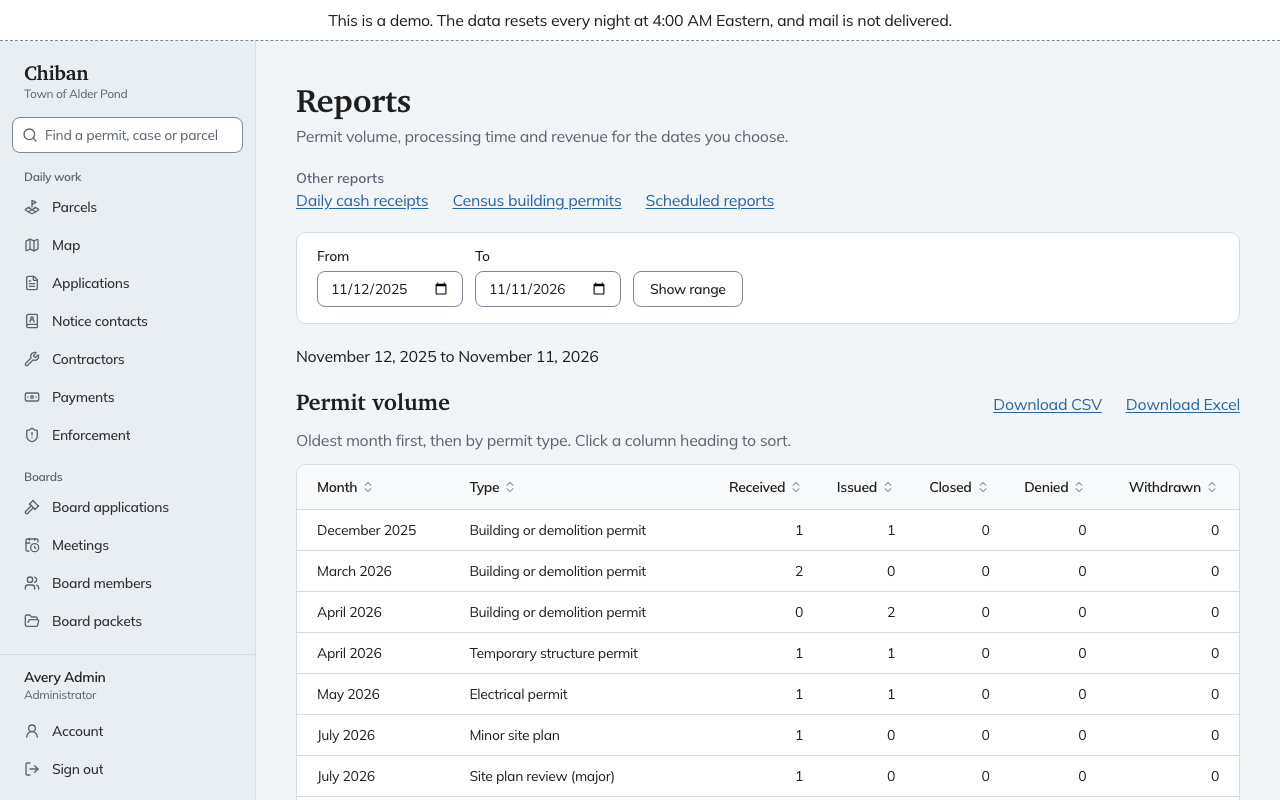
The Reports page answers the questions a select board, a budget meeting or the state asks the land use office: how many permits came in, how long they took, and how much money they brought in. Pick a range of dates and the page shows three tables. Each can be downloaded for a spreadsheet.
Administrators, land use staff and finance staff can open Reports. Revenue also needs the permission to see payment reports, which those same three roles have.
Choosing the dates
The page opens on the past year, ending today. Change From and To and choose Show range. A range can run up to five years. A longer one gets the message "Choose a range of at most five years." Below the form, the page repeats the dates it is showing.
Click any column heading to sort by it. Click again to reverse.
Permit volume
One row for each permit type in each month.
| Column | Counts |
|---|---|
| Received | Applications filed that month |
| Issued | Permits issued that month |
| Closed, Denied, Withdrawn | Applications that reached that outcome that month |
Each column counts by its own date, so a permit filed in October and issued in November adds to Received in October and to Issued in November.
Processing time
One row for each permit type, for permits issued or decided in the range. Times are in days.
| Column | Meaning |
|---|---|
| Issued | Permits issued in the range |
| Median days to issue, 90th percentile days | From the day it was filed to the day it was issued. The median is the middle permit. Nine in ten took that long or less |
| Median days to decision | From the day the application was complete to the decision, for types that have a decision deadline |
| Decided on time, Decided late | Decisions against that deadline |
| Decided | Applications decided in the range |
| Decided, not issued | Of those, how many were denied or never issued |
| Median days to decide, 90th percentile days to decide | From filing to decision |
A blank cell means there is nothing to measure, for example no decision deadline for that kind of permit.
Revenue
One row for each fee in each month, with the Net total. Net is what was paid less what was refunded or corrected. Some lines are not town revenue and are labelled so:
- Convenience fee (not town revenue), the card fee charged on top of an online payment.
- Overpayment held for refund (not town revenue).
- Simulated payments (not town revenue), practice payments on a demo or test town.
- Court-imposed fines are listed on their own line.
Revenue counts each payment on the business date it was recorded. The Daily cash receipts report, linked under Other reports, covers one day's money by payment method.
Downloading
Each table has Download CSV and Download Excel. Both cover the dates on the page and the same columns. The file is named for the report and the dates, for example permit-volume-2025-11-12-to-2026-11-11.csv. The CSV opens in Excel. The workbook keeps money as dollars and decimals as numbers, ready to add up.
Adding your own columns
An administrator can add number answers from a permit's form to the permit volume and processing time tables, such as the cost of work or the floor area. They appear as extra columns, and in the downloads. Permit volume adds up the applications received each month. Processing time adds up the permits issued. On a permit type's settings page, look for Report columns and Choose report columns. Applications made on an older form without that question show a blank.
Other reports
The page links to three more under Other reports: Daily cash receipts, Census building permits and Scheduled reports. The census report and scheduled reports have their own pages.